Everything You Need to Know About OEE
Overall equipment effectiveness is measured on a scale of 100%. If you're able to achieve that coveted perfect score, it means that you're only manufacturing A) good parts, B) as quickly as possible, with C) little to no stop time to speak of.
Overall equipment effectiveness, also commonly referred to as OEE for short, is a key performance indicator that contextualizes how well a manufacturing operation is utilizing its assets compared to their full potential. It allows owners and operators to fully understand how well they are performing during those periods when runs are scheduled versus how well they could be performing with maximum productivity and efficiency.
Measured out of 100%, a "perfect" OEE score means that a business is only producing high quality parts (of 100% quality) at the fastest speed possible (equaling 100% performance) and with no interruptions to speak of (generating 100% availability).
As stated, measuring OEE is a best practice - but when you consider how important these metrics are in terms of small and medium-sized businesses in particular remaining competitive, it may very well be the most important best practice in existence. By making an effort to fully understand both overall equipment effectiveness and any underlying losses, organizational leaders can uncover certain trends and patterns that likely would have otherwise gone undiscovered. They can gain critical insights into how to continuously improve their manufacturing process moving forward. Not only that, but they're also in a far better position to benchmark progress, eliminate waste and improve the productivity of their manufacturing equipment, among other benefits.
Closely related to this is the concept of TEEP, or total effective equipment performance. This takes your OEE score and quantifies it against calendar hours, rather than limiting the discussion only to scheduled operating hours as is the case with overall equipment effectiveness. A TEEP rating of 100% means that your operations have run with a perfect OEE score 24 hours a day, seven days a week, 365 days a year. This is otherwise referred to as loading, and a perfect score here is also 100%.
Overall, OEE is commonly used as one of the most important key performance indicators when talking about lean manufacturing. Many experts use OEE as a measure of true success to that end. OEE can be best illustrated by further breaking down the six metrics that make up the system, otherwise known as the "Six Big Losses."
What Are the Six Big Losses?
As the name suggests, the six big losses are those that make the most impact on the availability, performance and quality metrics that make up a company's OEE score. Once you know which one of these makes up your own biggest loss, you know exactly what to target to have the best chance at improving things moving forward.
Those Six Big Losses include things like:
- With regards to availability, the two biggest losses are planned downtime and breakdowns.
- Within the context of performance, the two biggest losses are minor stops and speed loss.
- Finally, when talking about quality, the two biggest losses are production rejects and rejects on start up.
The major reason why these losses are so specific is that once you know which one is having the highest negative impact on your own operations, you can get very specific in your response to both reduce the loss and improve your overall OEE score in the short term.
What You Need to Know About Calculating OEE and TEEP
As previously mentioned, the OEE of a manufacturing facility is calculated by taking a look at three different areas:
- Availability, which is the percentage of scheduled time that a production line or asset is available to operate. This is also commonly referred to as uptime.
- Performance, which is the speed at which that production line or asset runs relative to its maximum potential.
- Quality, which is the total percentage of good parts compared to all of the parts that have been produced. Depending on the specific segment of the manufacturing sector that you're in, you may have heard of this referred to as first pass yield or FPY.
When you break things down in this level of detail, each of those three areas points to some aspect of your current manufacturing process that can be targeted for improvement moving forward. OEE is also valuable because it can be applied to the individual piece of equipment or worker, to a specific shift or production line, or even to your entire business - the choice is yours.
Having said that, it's important to understand that it is very, very unlikely that any manufacturing process can run at a genuine 100% OEE rating. This is true regardless of the expertise of your employees, the quality of your equipment or the success of your business up to this point. Having said that, it's obviously a good idea to try to get as close as you can. A lot of manufacturers tend to use 85% as a benchmark or "rule of thumb," although you can obviously change this depending on your needs.
To calculate OEE, simply use the following formula:
- Availability X Performance X Quality.
Note that depending on your preferences, you can also use a different method. Some people choose to calculate OEE by dividing A) the minimum time that you would need to produce a specific number of parts under the best possible working conditions, and B) the actual time you needed to produce the parts in real life. Although both techniques essentially allow you to arrive at the same destination, so the choice is yours as to which you'd rather use or why.
To take things one step further and calculate total effective equipment performance, you'll need to multiply things by a forth element - loading. This is the percentage of the total calendar time that your equipment is actually scheduled for operation. That is to say, it doesn't make any sense to track things based on time when a machine wasn't supposed to be running in the first place.
Again, this is because TEEP measures effectiveness against calendar hours (meaning effectiveness relative to a production schedule of 24 hours a day, seven days a week, 365 days a year) as opposed to OEE, which simply takes a closer look at scheduled hours. Because of this, TEEP is a great way to gain a better understanding of your "bottom line" utilization of assets.
A Better Understanding of the Insight You'll Receive
To continue the discussion of TEEP, understand that the loading portion of the metric is a really effective way to take a closer look at schedule effectiveness. It's also designed to exclude any elements that might impact HOW your production lines are performing. Because of that, it's a higher level view than what availability, performance and quality are going to tell you.
Keep in mind that for any week, the total calendar time is always seven days at 24 consecutive hours. If your machines were running for five days at eight hours, that would be 40 hours. Divided by the 168 hours in an average week, you'd arrive at 0.238, or roughly 23.8% loading. Now, depending on the specific type of operation you're running, this isn't necessarily a bad thing at all. Maybe you're a small business and you only need to run a single shift to remain profitable. Maybe it is your choice to keep things running on this schedule. Nobody knows your business quite like you do and if this is a good score depending on what you're trying to accomplish, it's a good score - period.
However, if you know that you've had an issue with your operations and weren't sure why, a score like this could point to the fact that downtime and other issues are taking a far greater amount of time than you realized. For the purposes of troubleshooting, you would definitely want to dive deeper into the factors that impact your scheduled time to see what adjustments you can make.
Availability, on the other hand, is defined as the portion of OEE that represents scheduled time relative to that portion of time that the asset in question is available to operate. In other words, this is a measurement of uptime - if you need a particular machine to be able to run for eight hours and it was available to do so during that entire period with no issues, it would have an availability score of 100%.
It's equally important to note that the availability metric is designed to exclude the effects of quality and performance.
For the sake of example, let's say that you have a particular machine that is scheduled to run for eight hours and the operator is allowed to take a half hour break for lunch. During the break, something unexpected happens and that machine goes offline for an hour - or 30 minutes longer than it was supposed to.
The scheduled time in this example would obviously be 7.5 hours. The actual operating time, however, was eight hours minus the 30 minute break minus another unscheduled half hour, for a total of one hour of downtime. So in this case, 7.0 hours divided by 7.5 hours would be 0.93, or 93%. Again, this is taking into consideration both the fact that there was scheduled downtime planned (which isn't a problem) and that the actual downtime exceeded that time limit.
Performance is another important metric to understand, particularly as it relates to the speed at which your assets are running relative to their design speed. Think about it a bit like the gas pedal on a car. If you have a high performance vehicle that was designed to run at 100 MPH at peak efficiency and you're only running it at 50 MPH on average, its performance would be roughly 50%. This is a lot like that, only it focuses on your production lines, your equipment and their true capabilities.
As was true with the other metrics, performance is designed to exclude anything that effects quality and availability. Any losses that you experience due to wasted performance are usually called speed losses. Unfortunately, it's typically pretty difficult to determine speed losses because there are so many other potential factors involved in the discussion. This is a big part of the reason why most people just assign unknown losses to the "speed losses" category and take it from there.
For the sake of another example, let's say once again that a machine is scheduled to run for eight hours and the operator is allowed to take a half hour break, for a total of 7.5 hours. But again, something unexpected happened and that machine went offline for an extra half hour - taking our total down to seven hours.
You know that under the best possible conditions, that machine is capable of producing about 40 units per hour (this is total units, not only good units. Remember that performance doesn't really deal with quality). That would be 300 units over the course of the entire shift. Unfortunately, due to the aforementioned issue, you only produced 280. In this case, the equation would be 280 divided by 300, coming out at roughly 93% performance.
Finally, we arrive at the quality portion of the OEE metric - one designed to represent how many quality parts you're producing relative to all of the parts that you've produced. Again, this is a measurement of process yield and it doesn't go into detail about the impacts of things like availability and performance.
Any losses due to things like defects or operator error are called quality losses and quality stops. Things do get a little tricky here, as reworked units that are ultimately able to be corrected are only measured as unscheduled downtime. This is because the parts themselves did eventually wind up in the "quality" category, it just took a longer than expected amount of time to get there. Units that end up being scrapped, on the other hand, impact both the operation time and the total unit count for obvious reasons.
Here, the calculation is simple: just take the total number of units produced and subtract all of the defective units from that batch. Take whatever number you get and divide it by the total number of units produced.
To continue on with the same example as before, we know that you were able to produce 280 parts during that seven hour period - but lets say that 25 of them ended up needing to be scrapped due to defects.
280 minus 25 would be 255, which is the total number of quality parts you were able to walk away from at the end of the shift. That divided by the original 280 parts that you produced would give you a quality rating of 91%. Not too bad all things considered, but again - it probably could have been higher.
Using Insight to Inform the Future
But really, the main value of OEE is that it removes as much guesswork from the equation as possible. You can't measure what you're not tracking and with the right tools by your side, OEE allows you to dive deeper into just about everything. To go back to the above example, let's say that you finished out the day knowing that you didn't hit the 300 parts you were supposed to produce. Without OEE, that's really all you would know - and you would have to go looking for the reason why.
With OEE, you know exactly how many parts you didn't produce. You know what percentage of parts that you DID produce needed to be scrapped. You know exactly what caused the discrepancy - unplanned downtime. You also know why it happened. You know everything you need to prevent the issue from happening again, which is really the most important goal of all.
Overall equipment effectiveness is particularly helpful as a heuristic - meaning that it's a problem solving approach that uses a very practical method to reach an immediate, short-term goal as quickly as possible.
Having said that, there are a number of circumstances that could skew the quality of the conclusions that you're able to draw from it. Depending on the type of manufacturing business you're running, for example, it may cost more money to run your facility at certain times of the day or week. At that point, running an OEE calculation may be totally different compared to another day, even through a lot of the factors remained the same. Likewise, factors like performance and quality may not necessarily be independent of one another in the way that OEE requires. They might not also be independent of availability or even loading, too. It's all going to depend on the specific makeup of the business in question.
In other words, nobody is perfect - certainly not OEE and probably not your business, either. But when you pair that business with the insight generated from OEE, you put yourself in an excellent position to move as close to that magical line as possible.
About the Author:
This Article is written by Tim Saddoris, the founder of Thrive MES - a provider of downtime tracking and OEE software for clients in food and beverage, pharmaceuticals, automotive manufacturing, metal product manufacturing and other related industries.
Featured Product
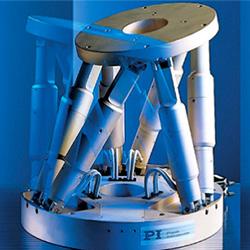
PI USA - Hexapod for Industrial Alignment
This new compact 6-axis hexapod was designed with 24/7 industrial precision alignment tasks and easy serviceability in mind. It is equipped with absolute encoders (no need for referencing) and motor brakes that automatically engage during a loss of power, for extra safety. Debuting at Photonics West 2025 last month, applications include camera lens alignment, micro assembly, and fiber optical alignment applications.