When developing firmware using a Real-Time Operating System (RTOS), how do you measure the software performance?
RTOS 101: Performance Analysis with Tracealyzer
Terri Hawker | KINGSTAR
When developing firmware using a Real-Time Operating System (RTOS), how do you measure the software performance? One important aspect of performance analysis is response time, the time from point A to point B in the code, e.g., from when a task is activated until it is completed. This can be measured in many ways, e.g., by toggling an I/O pin and measuring with a logic analyzer, or by adding some extra code that measures the number of clock cycles between the two points. But a basic measurement is like this only measures the total amount of processor time between these points, without any information about contributing factors, such as interrupts routines or other tasks that interfere due to preemptive scheduling (see RTOS 101: Task Scheduling and Analysis with Tracealyzer).
Another important performance aspect of performance analysis is execution time, the actual processor time used by a particular piece of code. You might use solutions that samples the program counter and provides a high level overview of those using the most processor time. This is supported by several common IDEs and most ARM-based MCUs provide hardware support for this purpose. This is however an average measurement of the typical distribution and is inaccurate for less frequent functions or tasks. Moreover, this does not reveal sporadic cases of unusually long executions that might cause problems such as timeouts.
To get an exact picture of the RTOS behavior you need a solution for RTOS tracing. Tools for this purpose have been around for many years, but only for certain operating systems and each tool typically only support a particular operating system. They typically display a horizontal Gantt chart showing the task execution over time. This is however not ideal for RTOS traces as it is hard to show other events in parallel, such as RTOS API calls.
IntervalZero’s RTOS (Real-Time Operating System) Platform is a standard, pre-integrated application development platform that allows companies to focus solely on delivering their value-added applications. IntervalZero’s RTX and RTX64 software replace FPGAs and DSPs for hard real-time requirements, radically reducing the development costs, and significantly improving the quality of embedded systems.
Tracealyzer is available for IntervalZero’s RTX64 3.0 product, and provides a sophisticated visualization that makes it easier to comprehend the traces.

Figure 1: Actors, Instances and Fragmens in Tracealyzer
The main view of Tracealyzer (Figure 1) uses a vertical time-line, that allows for showing not only RTOS scheduling and interrupts, but also other events such as RTOS calls or custom “User Events”, using horizontal text labels. These labels “float” and spread out evenly to avoid overlaps. The rectangles in the scheduling trace corresponds to intervals of uninterrupted execution. These are called “fragments” in Tracealyzer. The term “Actor” is used to denote all execution contexts in the traced system, such as tasks and interrupt handlers. The task scheduling can be rendered in different ways, or “View Modes”, with associated buttons found under the Zoom buttons. In this mode, the fragments are ordered in multiple columns, one for each Actor.
Tracealyzer has a concept of “instances” not found in other RTOS tracing tools, meaning a particular execution of an Actor, i.e., from when a “job” is triggered until it is finished. The instance concept is quite central in Tracealyzer, since used both in the trace visualization and for providing timing statistics. When clicking on the actor fragment in the Tracealyzer main view, the Actor Instance is highlighted with a blue rectangle, shown in Figure 1.
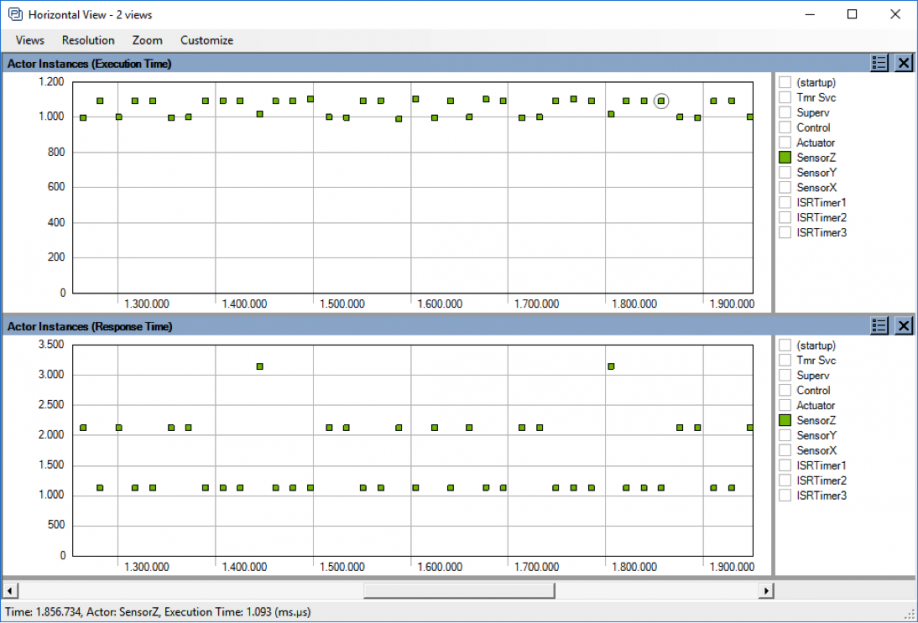
Figure 2: Plot showing the variations in execution time and response times, over time.
Moreover, performance metrics such as execution time and response time are calculated for each instance and can be visualized as detailed plots showing the variations over time (Figure 2 above) and as histograms showing the distributions. The latter is shown in Figure 3 (below) where we can see that the highest response time of “Control Task” is 3255 us in this trace, while the highest execution time is just 1087 us, meaning that most of the response time is due to interference from other tasks or interrupts.
All views in Tracealyzer are interconnected, so by clicking on the plotted data points or the histogram bars, you find the corresponding locations in the main trace view and can see the detailed RTOS behavior behind the statistics.
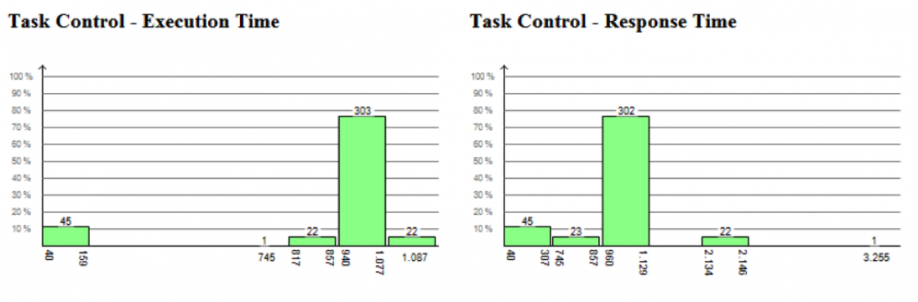
Figure 3: Distribution of execution times and response times for the task instances.
Great, but how is the stream of task scheduling events grouped into task instances? This is not obvious for cyclic RTOS tasks, where an instance corresponds to an iteration of the main loop, delimited by a blocking RTOS call, e.g., a “QueueRecieve” or a “DelayUntil” somewhere in the loop. But a task might perform multiple such calls, so does Tracealyzer know where to end the current instance and begin a new instance?
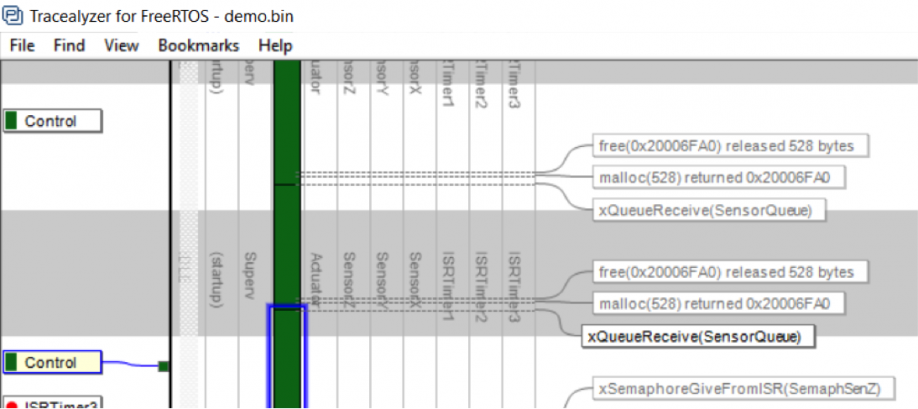
Figure 4: Instance Finish Events (IFEs) allows for custom instance definitions.
For this purpose, Tracealyzer has a concept of “instance finish events” (IFEs) that are defined in two ways. Users don’t need to bother about this in most cases, as there is a set of standard rules that specify what RTOS calls that normally should be counted as IFEs, such as Delay calls and QueueRecieve calls. This requires no extra configuration and is usually correct. However, for cases these implicit rules are unsuitable, you may generate explicit events (IFEs) that marks the instance as finished, this by calling a certain function in our recorder library. An example of this is shown in Figure 4 (above), where the dark green control task is divided into multiple instances despite no task-switches occurring at these points. This way you can manually decide how to group the events into instances, and thereby the control the meaning of the timing statistics.
With Tracealyzer you get a superb solution for performance analysis, debugging and validation of RTOS-based embedded software. You get an exact picture of how the RTOS is executing your application, including many performance statistics such as execution time and response time for the tasks. And you also get detailed trace views that explains what has affected the timing. This gives invaluable insight into the runtime world and facilitate development, validation and debugging of RTOS-based embedded software. Tracealyzer is also available for analysis of Linux systems.
We have several new and exciting analysis features in development that allows for even better performance analysis, so stay tuned!
About Terri Hawker
Terri Hawker heads IntervalZero’s Product Management initiatives and chairs the company’s Development Committee (DevCom), which guides overall product development strategy and approves the roadmap for the company’s flagship hard real-time software products, RTX64 and RTX. Terri establishes the product requirements for each release of RTX64 and RTX by carefully assessing market trends and forces; by considering customers’ product enhancement requests and their product feedback; and by consulting regularly with the customers’ senior leadership as well as sales and R&D executives. She shepherds the feature set through the agile product development process all the way through product delivery from engineering to manufacturing.
The content & opinions in this article are the author’s and do not necessarily represent the views of ManufacturingTomorrow
Featured Product