TOSHULIN gains a competitive advantage thanks to the displayed data of the visualization and the company knows how to use it cleverly and effectively. The attractive and user-friendly visualization displays the necessary output data for the end-users to further analyse.
Case Study: TOSHULIN Chooses mySCADA
Contributed by | MySCADA Technologies
This reference describes a real project in which mySCADA (software and hardware provider) and TOSHULIN (global manufacturer of the machine tools) collaborated. This is the first collaboration in a long-term relationship which will be profitable for both sides.
Cooperation
TOSHULIN produces machine tools which includes a control system from Siemens company. Due to increasing requirements of customers and the pressure of Industry 4.0 and its expansion, the manufacturing company decided to modernize their current portfolio for a better customer comfort. Based on the supplier offers, TOSHULIN chose mySCADA which fits with their strategy the most.
ABOUT THE PROJECT
The pilot project was applied on the machine tool EXPERTURN 1600C. The main authority request contains to ensure the collecting and logging of outputs which are in the current control system. These outputs can be analysed and processed later. A modern and fresh-looking visualization was the second requirement, the third one was the ability for remote access.
To add visualization into the machine tool was a strategic and sales decision. TOSHULIN wanted to offer new features which would bring time and money savings as well as a sales increase. The visualization provides a rare and necessary competitive advantage compared to other machine tool manufacturers.
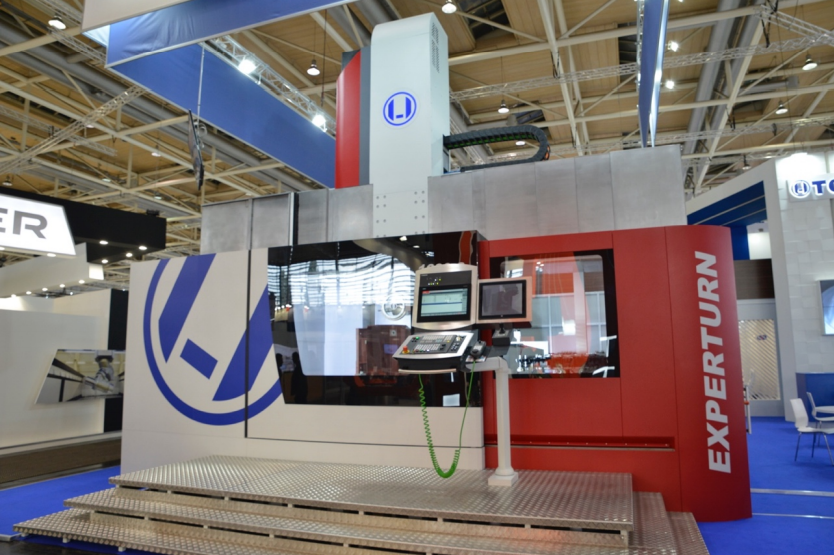
Machine Expertrun 1600C (picture was taken at EMO Trade Fair 2017 in Hannover)
Project assignment
- Data logging and its visualization
- Modern look of the visualization (compatible with Industry 4.0)
- Remote access of the machine
Based on these requirements, mySCADA recommended the use of the myBOX. myBOX is a combination of software for data visualization and hardware that is used as an industrial computer. Therefore, there is no need to buy any additional hardware equipment.
.jpg)
Scheme of myBOX connection
.jpg)
Scheme of myBOX connection to the control system
The HMI (Siemens panel) is connected to the control system through the bus which communicates with the engines, sensors, frequency converters and other parts of the TOSHULIN machine. For the myBOX data visualization, the OPC server has to be available in the control system. (myBOX is connected to the control system via Ethernet cable. Thanks to this cable, myBOX communicates with the OPC server.)
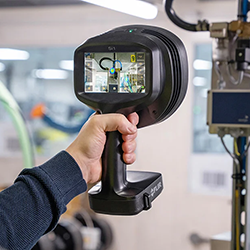
myBOX enables a user to see and maintain the visualization using a WiFi connection. To display the visualization, the IP address and a web browser are needed. In case that myBOX is equipped with a SIM card or Internet connection, remote access through a VPN is possible to follow the processes or set up the myBOX from anywhere.
Note. For some data available in the visualization, the user has to have a special knowledge to get it.
PROJECT - VISUALIZATION
When product myBOX was deployed, TOSHULIN was able to log data immediately and save it in the myBOX memory module for later analysis. Below is a list of screens displaying the information to the user. It contains mainly machine and production information, the project is monitored via a web browser. In this specific case, the project is monitored with a tablet, but when using web browser, the access is possible from any device such as mobile phone, notebook, or desktop computer.
Note. mySCADA offers a mobile application myMOBILE which can also be used for the project access and myMOBILE works for Android and iOS operating systems. TOSHULIN do not use this application.
Screens
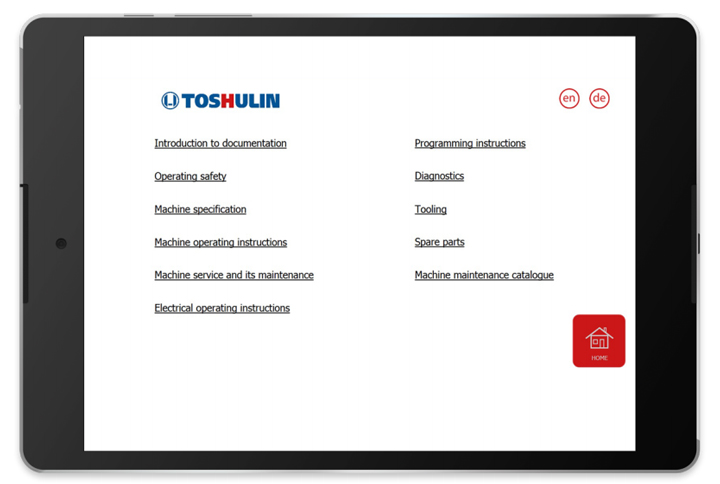
The homepage screen shows the user a complete overview of information available. The main branching gets 8 different parts: each part can include any number of other views based on user requirements and size of the project.
.jpg)
Homepage
The machine status is important for service and maintenance of the machine. In the picture, there is some basic (Pic. 5) as well as more in-depth (Pic. 6) information about the machine tool.
.jpg)
The state of the machine
.jpg)
Level indicators
The next parameter which is helpful for users to monitor and analyze are temperature conditions for each phase of the production. In Picture 7, there is an overview of the spindles inside the machine.
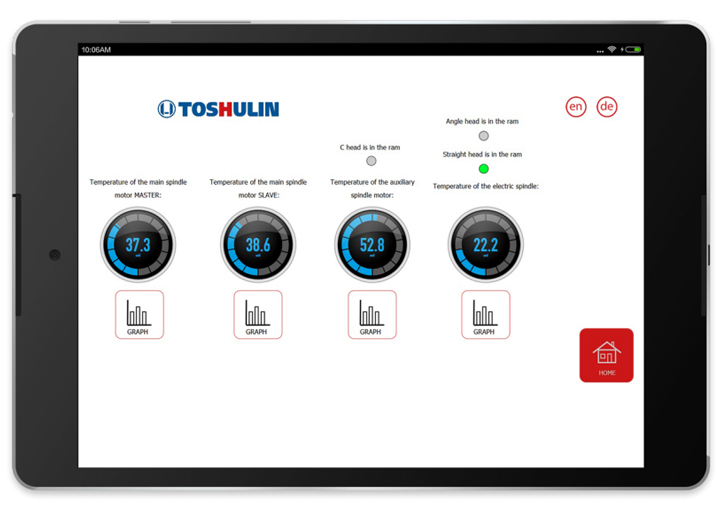
Spindles temperature
For detailed information, it is necessary to click on the icon of the graph which is located under every object. Picture 8 shows the new information contained in the graph. The advantage for end users is to get the information of the temperatures backwards. This helps in analysing and the prediction of future machine status.
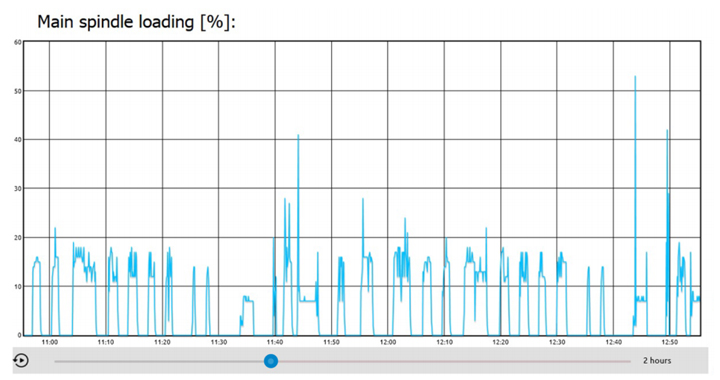
Picture 8 - Detailed information of temperature in main spindle MASTER
The alarm view offers a list of expected and unexpected changes in the system. This screen allows the user to get the overview of machine functionality, efficiency, the other useful information for increasing productivity and service life of the machine.
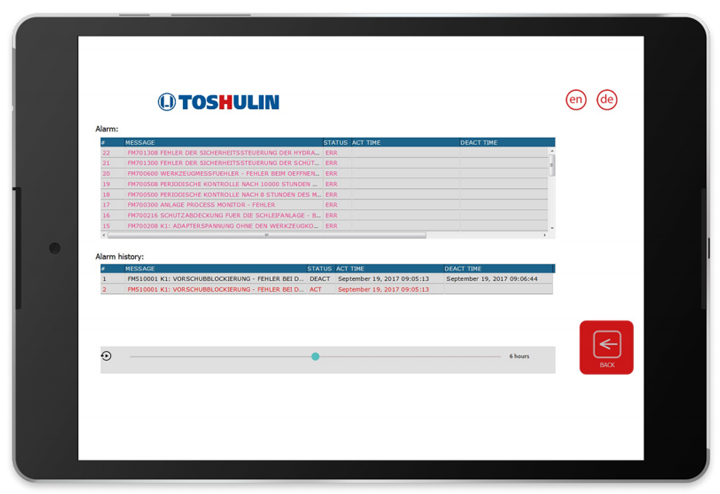
Picture 9 - Alarms
The common disadvantage of any manufacturing machine is the inability to control the production from inside (no one can see into the machine). TOSHULIN came up with an idea for solving this by installing a camera directly into the machine. The camera captures the production nonstop and sends it live to the visualization. A trained end user is able to watch and control the production anywhere (even over the continent) via web browser.
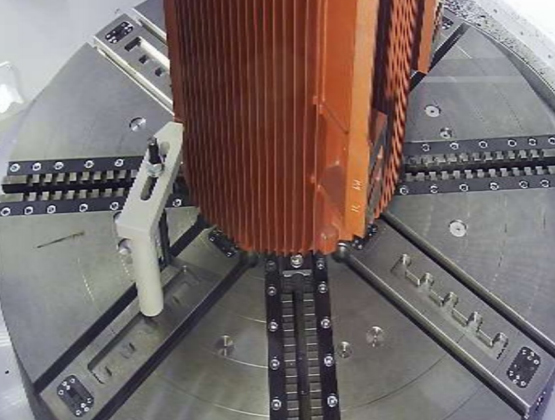
Picture 10 - CCTV inside the machine
Other screens
Picture 11 - Machine documentation (PDF)
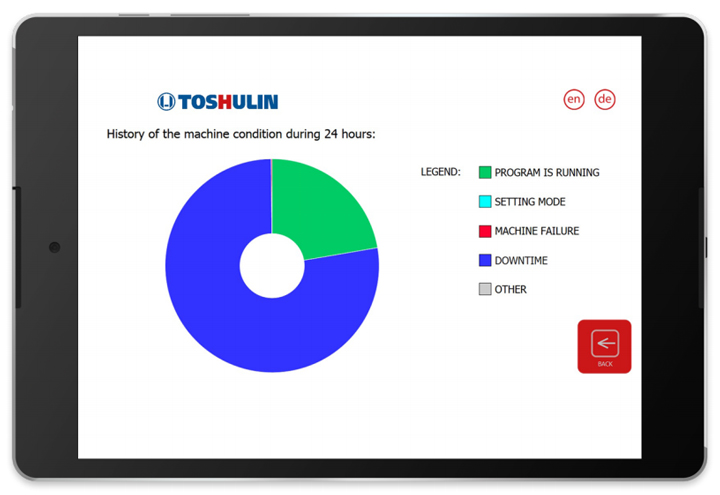
Picture 12 – Status of the machine
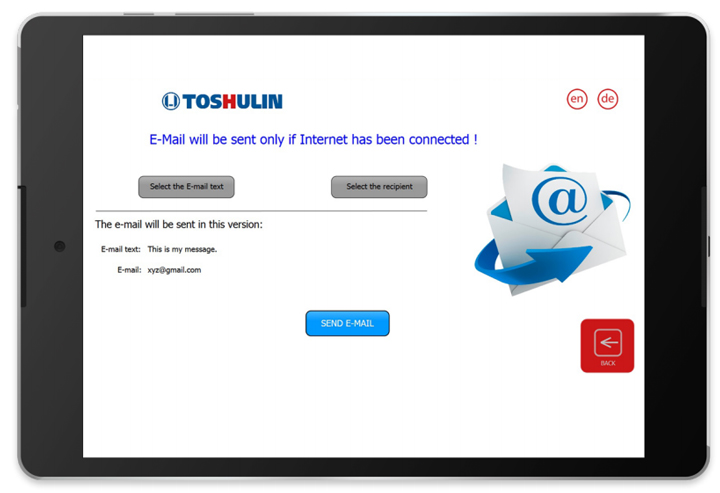
Picture 13 - Email notifications when failures
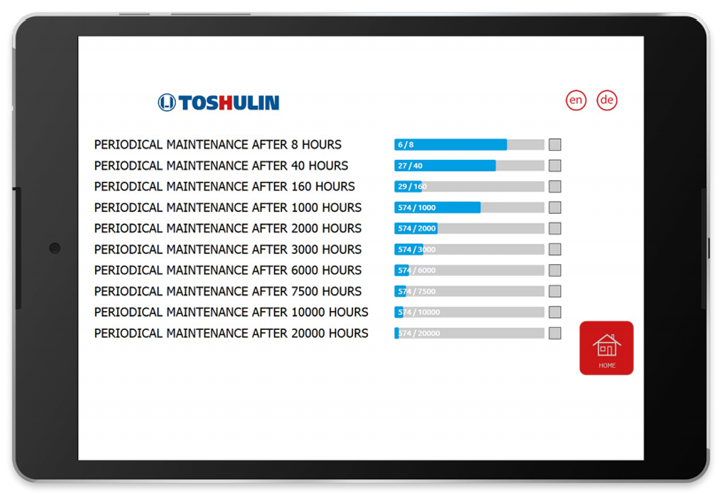
Picture 14 - Regular maintenance – status
ADDED VALUE OF THE SYSTEM
The remote access and the capability of online control of the machine anytime from anywhere is, according to TOSHULIN’s technical director Mr. Vojtech Frkal, the greatest value of the visualization. The users also appreciate the general overview of the machine and live stream of the environment inside the machine.
CONCLUSION
TOSHULIN gains a competitive advantage thanks to the displayed data of the visualization and the company knows how to use it cleverly and effectively. The attractive and user-friendly visualization displays the necessary output data for the end-users to further analyse.
The content & opinions in this article are the author’s and do not necessarily represent the views of ManufacturingTomorrow
Comments (0)
This post does not have any comments. Be the first to leave a comment below.
Featured Product